🎯 Mục tiêu bài học
Sau bài học này, học viên sẽ:
✅ Hiểu ROC Curve và cách vẽ
✅ Nắm vững AUC và ý nghĩa
✅ Biết công thức và cách tính Gini Coefficient
✅ Phân biệt Gini Coefficient với Gini Impurity
Thời gian: 4-5 giờ | Độ khó: Theory
� Bảng Thuật Ngữ Quan Trọng
| Thuật ngữ | Tiếng Việt | Giải thích đơn giản |
|---|---|---|
| ROC Curve | Đường cong ROC | Đồ thị TPR vs FPR ở các threshold |
| AUC | Diện tích dưới ROC | Đo khả năng phân biệt của model |
| TPR (Recall) | Tỷ lệ dương thật | TP/(TP+FN) |
| FPR | Tỷ lệ dương giả | FP/(FP+TN) |
| Gini Coefficient | Hệ số Gini | 2×AUC - 1 |
| Threshold | Ngưỡng | Điểm cắt quyết định class |
| Sensitivity | Độ nhạy | = Recall = TPR |
| Specificity | Độ đặc hiệu | TN/(TN+FP) |
Checkpoint
Bạn đã đọc qua bảng thuật ngữ? Hãy ghi nhớ chúng!
�📈 ROC Curve
1. ROC Curve
1.1 Định nghĩa
ROC (Receiver Operating Characteristic) là đồ thị thể hiện trade-off giữa:
- TPR (True Positive Rate) = Recall = Sensitivity
- FPR (False Positive Rate) = 1 - Specificity
1.2 Công thức
1.3 Cách vẽ ROC Curve
| Bước | Mô tả |
|---|---|
| 1 | Model output probabilities |
| 2 | Thay đổi threshold từ 0 đến 1 |
| 3 | Tính TPR, FPR cho mỗi threshold |
| 4 | Plot các điểm (FPR, TPR) |
| 5 | Nối các điểm thành ROC Curve |
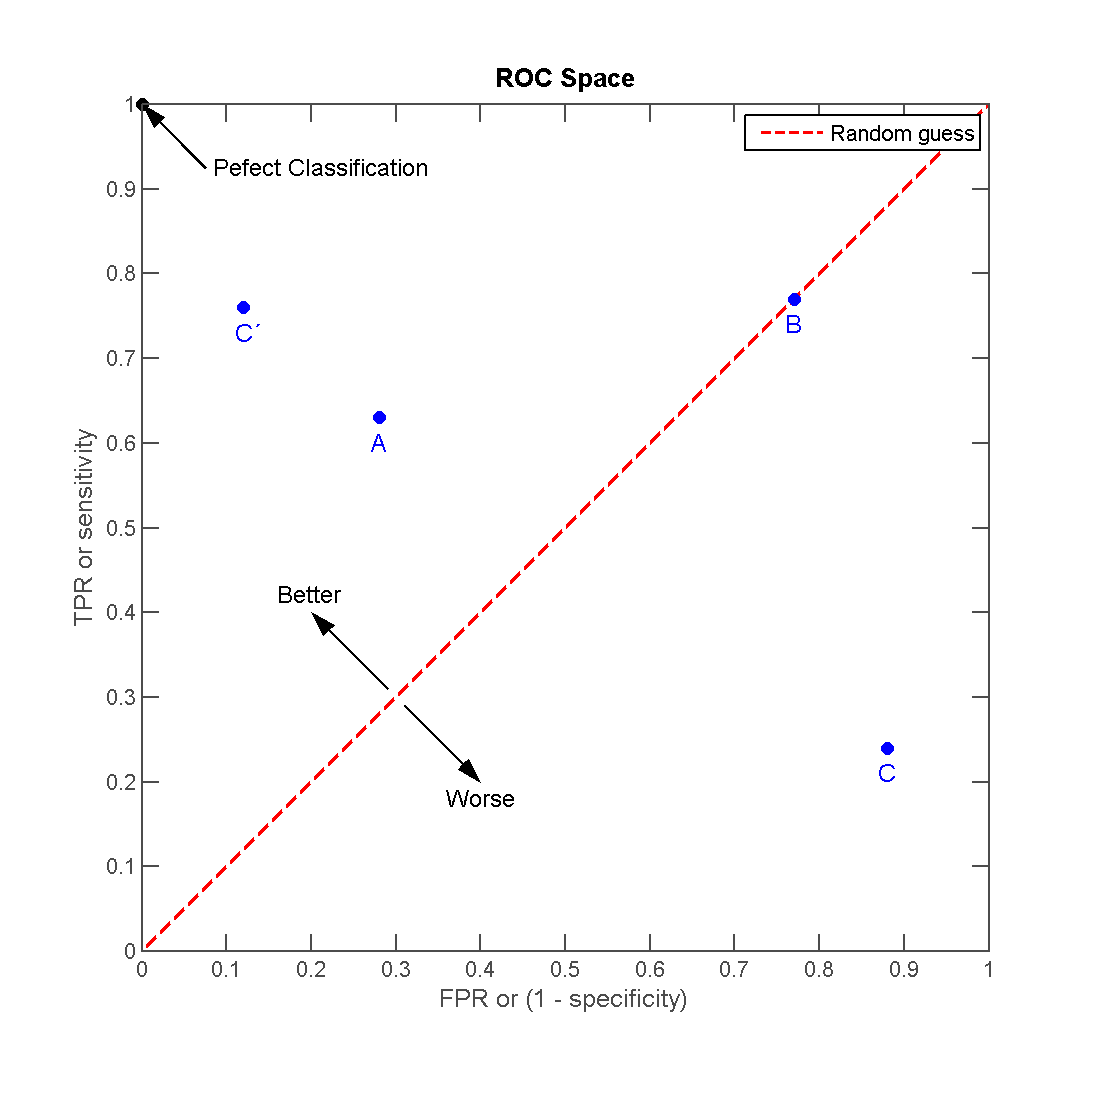
Hình: ROC Space - Các điểm trong không gian ROC
📝 Ví dụ tính toán thủ công ROC
2. Ví dụ tính toán thủ công ROC
2.1 Dữ liệu
| Sample | True Label | P(Positive) |
|---|---|---|
| A | 1 | 0.95 |
| B | 1 | 0.85 |
| C | 0 | 0.70 |
| D | 1 | 0.65 |
| E | 0 | 0.55 |
| F | 0 | 0.40 |
| G | 1 | 0.30 |
| H | 0 | 0.20 |
Tổng: 4 Positive, 4 Negative
2.2 Tính TPR, FPR cho các thresholds
Threshold = 0.9:
- Predict Positive: A
- TP = 1, FP = 0, FN = 3, TN = 4
- TPR = 1/4 = 0.25, FPR = 0/4 = 0
Threshold = 0.8:
- Predict Positive: A, B
- TP = 2, FP = 0, FN = 2, TN = 4
- TPR = 2/4 = 0.50, FPR = 0/4 = 0
Threshold = 0.6:
- Predict Positive: A, B, C, D
- TP = 3, FP = 1, FN = 1, TN = 3
- TPR = 3/4 = 0.75, FPR = 1/4 = 0.25
Threshold = 0.5:
- Predict Positive: A, B, C, D, E
- TP = 3, FP = 2, FN = 1, TN = 2
- TPR = 3/4 = 0.75, FPR = 2/4 = 0.50
Threshold = 0.35:
- Predict Positive: A, B, C, D, E, F
- TP = 3, FP = 3, FN = 1, TN = 1
- TPR = 3/4 = 0.75, FPR = 3/4 = 0.75
Threshold = 0.25:
- Predict Positive: A, B, C, D, E, F, G
- TP = 4, FP = 3, FN = 0, TN = 1
- TPR = 4/4 = 1.00, FPR = 3/4 = 0.75
2.3 Bảng tổng hợp ROC Points
| Threshold | TPR | FPR |
|---|---|---|
| 1.0 | 0.00 | 0.00 |
| 0.9 | 0.25 | 0.00 |
| 0.8 | 0.50 | 0.00 |
| 0.6 | 0.75 | 0.25 |
| 0.5 | 0.75 | 0.50 |
| 0.35 | 0.75 | 0.75 |
| 0.25 | 1.00 | 0.75 |
| 0.0 | 1.00 | 1.00 |
Checkpoint
Bạn có thể tính TPR và FPR cho một threshold cụ thể không?
📊 AUC (Area Under Curve)
3. AUC (Area Under Curve)
3.1 Định nghĩa
AUC = Diện tích duoi duong ROC
3.2 Ý nghĩa
"Xác suất model xếp hạng một positive sample cao hơn mot negative sample"
3.3 Giải thích gia tri AUC
| AUC | Ý nghĩa |
|---|---|
| 1.0 | Perfect classifier |
| 0.9 - 1.0 | Excellent |
| 0.8 - 0.9 | Good |
| 0.7 - 0.8 | Fair |
| 0.6 - 0.7 | Poor |
| 0.5 | Random guess (đường chéo) |
| < 0.5 | Worse than random |
3.4 Tính AUC bang Trapezoidal Rule
📉 Gini Coefficient
4. Gini Coefficient
4.1 Công thức
4.2 Ý nghĩa
| AUC | Gini | Ý nghĩa |
|---|---|---|
| 1.0 | 1.0 | Perfect |
| 0.9 | 0.8 | Excellent |
| 0.8 | 0.6 | Good |
| 0.7 | 0.4 | Fair |
| 0.5 | 0.0 | Random |
4.3 Vi du tinh
Neu AUC = 0.85:
4.4 QUAN TRỌNG: Gini Coefficient vs Gini Impurity
| Gini Coefficient | Gini Impurity | |
|---|---|---|
| Đúng cho | Đánh giá model | Decision Tree split |
| Công thức | ||
| Range | 0 đến 1 | 0 đến 0.5 |
| Càng cao | Model càng tốt | Node càng không thuần |
Checkpoint
Bạn đã phân biệt được Gini Coefficient và Gini Impurity chưa?
💻 Thực hành với Scikit-learn
5. Thực hành với Scikit-learn
5.1 Code vẽ ROC và tính AUC
1import numpy as np2from sklearn.datasets import make_classification3from sklearn.model_selection import train_test_split4from sklearn.linear_model import LogisticRegression5from sklearn.metrics import roc_curve, auc, roc_auc_score6import matplotlib.pyplot as plt78# Tạo dữ liệu9X, y = make_classification(n_samples=1000, n_features=20, 10 n_classes=2, random_state=42)11X_train, X_test, y_train, y_test = train_test_split(12 X, y, test_size=0.3, random_state=4213)1415# Train model16model = LogisticRegression()17model.fit(X_train, y_train)1819# Lấy probabilities20y_prob = model.predict_proba(X_test)[:, 1]2122# Tính ROC curve23fpr, tpr, thresholds = roc_curve(y_test, y_prob)24roc_auc = auc(fpr, tpr)25gini = 2 * roc_auc - 12627print(f"AUC: {roc_auc:.4f}")28print(f"Gini Coefficient: {gini:.4f}")2930# Ve ROC Curve31plt.figure(figsize=(10, 8))32plt.plot(fpr, tpr, color='blue', lw=2, 33 label=f'ROC curve (AUC = {roc_auc:.3f})')34plt.plot([0, 1], [0, 1], color='gray', lw=2, 35 linestyle='--', label='Random (AUC = 0.5)')36plt.xlim([0.0, 1.0])37plt.ylim([0.0, 1.05])38plt.xlabel('False Positive Rate (FPR)')39plt.ylabel('True Positive Rate (TPR)')40plt.title('ROC Curve')41plt.legend(loc='lower right')42plt.grid(True)43plt.show()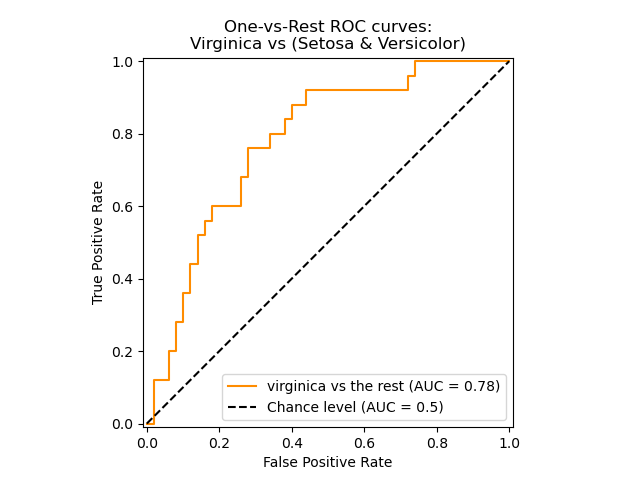
Hinh: Vi du ROC Curve tu Scikit-learn
5.2 So sanh nhieu models
1from sklearn.ensemble import RandomForestClassifier2from sklearn.svm import SVC34# Train multiple models5models = {6 'Logistic Regression': LogisticRegression(),7 'Random Forest': RandomForestClassifier(n_estìmators=100),8 'SVM': SVC(probability=True)9}1011plt.figure(figsize=(10, 8))1213for name, model in models.items():14 model.fit(X_train, y_train)15 y_prob = model.predict_proba(X_test)[:, 1]16 fpr, tpr, _ = roc_curve(y_test, y_prob)17 roc_auc = auc(fpr, tpr)18 plt.plot(fpr, tpr, lw=2, label=f'{name} (AUC = {roc_auc:.3f})')1920plt.plot([0, 1], [0, 1], 'k--', lw=2, label='Random')21plt.xlabel('False Positive Rate')22plt.ylabel('True Positive Rate')23plt.title('ROC Curve Comparison')24plt.legend(loc='lower right')25plt.grid(True)26plt.show()🎯 Khi nào dùng ROC-AUC?
6. Khi nào dùng ROC-AUC?
Uu điểm
- Khong phu thuoc vao threshold
- Tot cho imbalanced data
- So sanh duoc nhieu models
- Đánh giá kha nang ranking
Nhuoc điểm
- Khong cho biet performance o threshold cu the
- Co the misleading voi highly imbalanced data
- Khong truc quan nhu Precision/Recall
Khi nào dùng
| Tính huong | Metric phu hop |
|---|---|
| So sanh models | AUC |
| Imbalanced data | AUC hoac PR-AUC |
| Can threshold cu the | F1, Precision, Recall |
| Ranking quality | AUC |
📝 Tổng Kết
Key Takeaways:
- 📈 ROC Curve thể hiện TPR vs FPR ở mọi threshold
- 📊 AUC = 1.0 (hoàn hảo), = 0.5 (đoán random), < 0.5 (tệ hơn random)
- 💰 Gini = 2×AUC - 1 phổ biến trong banking/credit scoring
- 💻 Scikit-learn:
roc_curve(),roc_auc_score() - ⚖️ Multi-class: dùng macro/weighted average AUC
Bài tập tự luyện
- Bài tập 1: Tính AUC bằng tay cho 5 samples với labels và probabilities
- Bài tập 2: Vẽ ROC curve và tính Gini cho model trên Titanic dataset
- Bài tập 3: So sánh AUC của Logistic Regression vs Random Forest
Tài liệu tham khảo
| Nguồn | Link |
|---|---|
| Scikit-learn ROC Curve | scikit-learn.org |
| Understanding ROC Curves | towardsdatascience.com |
| Google ML - ROC and AUC | developers.google.com |
Câu hỏi tự kiểm tra
- ROC Curve thể hiện mối quan hệ giữa TPR và FPR như thế nào? Đường chéo y = x có ý nghĩa gì?
- AUC = 0.5 và AUC = 1.0 có ý nghĩa gì? AUC < 0.5 xảy ra khi nào?
- Gini Coefficient và Gini Impurity khác nhau như thế nào? Công thức Gini = 2×AUC - 1 được dùng trong lĩnh vực nào?
- Khi nào nên dùng ROC-AUC và khi nào nên dùng PR-AUC để đánh giá model?
🎉 Tuyệt vời! Bạn đã hoàn thành bài học ROC-AUC và Gini Coefficient!
Tiếp theo: Cùng học Threshold Analysis — cách chọn ngưỡng tối ưu cho model!
Checkpoint
Bạn đã nắm vững ROC-AUC chưa? Sẵn sàng sang Threshold Analysis!