🎯 Mục tiêu bài học
Sau bài học này, học viên sẽ:
✅ Hiểu ảnh hưởng của threshold đến Precision và Recall
✅ Biết cách chọn threshold tối ưu theo từng bài toán
✅ Nắm vững Precision-Recall Curve và khi nào dùng
✅ Thực hành với Scikit-learn
Thời gian: 3-4 giờ | Độ khó: Theory
📖 Bảng Thuật Ngữ Quan Trọng
| Thuật ngữ | Tiếng Việt | Giải thích đơn giản |
|---|---|---|
| Threshold | Ngưỡng | Điểm cắt phân class (mặc định 0.5) |
| Precision-Recall Curve | Đường PR | Đồ thị Precision vs Recall theo threshold |
| F1-Score | Điểm F1 | Harmonic mean của Precision và Recall |
| F-beta Score | F-beta | F1 tổng quát với trọng số beta |
| Average Precision | AP | Diện tích dưới PR curve |
| Optimal Threshold | Ngưỡng tối ưu | Threshold tối đa hóa metric mục tiêu |
| Business Constraint | Ràng buộc nghiệp vụ | Yêu cầu thực tế (VD: Recall >= 0.9) |
Checkpoint
Bạn đã đọc qua bảng thuật ngữ? Hãy ghi nhớ chúng!
🎚️ Threshold trong Classification
1. Threshold trong Classification
1.1 Định nghĩa
Threshold là ngưỡng quyết định để chuyển probability thành class.
Default: threshold = 0.5
1.2 Trade-off Precision vs Recall
| Thay đổi | Precision | Recall | FP | FN |
|---|---|---|---|---|
| Tăng Threshold | Tăng | Giảm | Giảm | Tăng |
| Giảm Threshold | Giảm | Tăng | Tăng | Giảm |
📝 Ví dụ tính toán thủ công
2. Ví dụ tính toán thủ công
2.1 Dữ liệu
| Sample | True Label | P(Positive) |
|---|---|---|
| 1 | 1 | 0.95 |
| 2 | 1 | 0.80 |
| 3 | 0 | 0.75 |
| 4 | 1 | 0.60 |
| 5 | 0 | 0.55 |
| 6 | 1 | 0.40 |
| 7 | 0 | 0.30 |
| 8 | 0 | 0.20 |
Tổng: 4 Positive, 4 Negative
2.2 Threshold = 0.7
| Predict 0 | Predict 1 | |
|---|---|---|
| True 0 | TN=3 | FP=1 |
| True 1 | FN=2 | TP=2 |
2.3 Threshold = 0.5
| Predict 0 | Predict 1 | |
|---|---|---|
| True 0 | TN=2 | FP=2 |
| True 1 | FN=1 | TP=3 |
2.4 Threshold = 0.35
| Predict 0 | Predict 1 | |
|---|---|---|
| True 0 | TN=1 | FP=3 |
| True 1 | FN=0 | TP=4 |
2.5 Tổng hop
| Threshold | Precision | Recall | F1 |
|---|---|---|---|
| 0.70 | 0.667 | 0.500 | 0.571 |
| 0.50 | 0.600 | 0.750 | 0.667 |
| 0.35 | 0.571 | 1.000 | 0.727 |
Checkpoint
Bạn có thể giải thích tại sao tăng threshold lại tăng Precision nhưng giảm Recall không?
📈 Precision-Recall Curve
3. Precision-Recall Curve
3.1 Khi nào dùng PR Curve thay vì ROC?
| Tính huong | Đúng |
|---|---|
| Data balanced | ROC Curve |
| Data highly imbalanced | PR Curve |
| Positive class quan trọng | PR Curve |
| Overall ranking | ROC Curve |
3.2 Tại sao PR Curve tot hon cho Imbalanced Data?
Vi du: 990 Negative, 10 Positive
- FPR = FP / (FP + TN) = 10 / 990 = 0.01 (rất nhỏ dù FP = 10)
- Precision = TP / (TP + FP) = 5 / 15 = 0.33 (thể hiện rõ vấn đề)
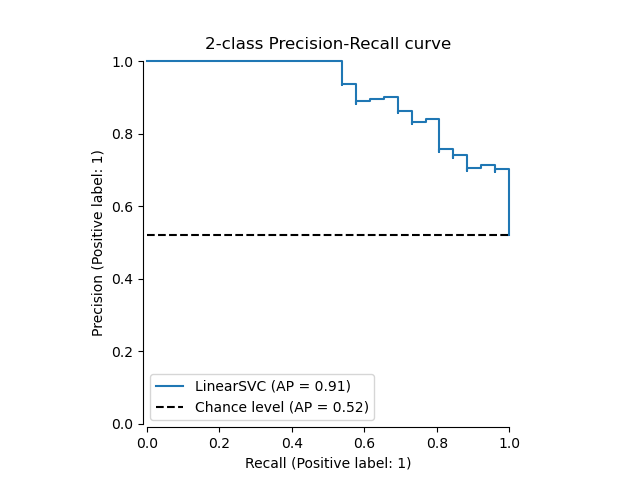
Hinh: Precision-Recall Curve tu Scikit-learn
🎯 Chọn Threshold tối ưu
4. Chọn Threshold tối ưu
4.1 Phương pháp 1: Tối đa F1-Score
1from sklearn.metrics import precision_recall_curve2import numpy as np34precision, recall, thresholds = precision_recall_curve(y_test, y_prob)56# Tính F1 cho mỗi threshold7f1_scores = 2 * (precision * recall) / (precision + recall + 1e-10)89# Tìm threshold tối ưu10optìmal_idx = np.argmax(f1_scores)11optìmal_threshold = thresholds[optìmal_idx]12optìmal_f1 = f1_scores[optìmal_idx]1314print(f"Optìmal Threshold: {optìmal_threshold:.4f}")15print(f"F1 at optìmal: {optìmal_f1:.4f}")4.2 Phương pháp 2: Youđến's J Statistic (cho ROC)
1from sklearn.metrics import roc_curve23fpr, tpr, thresholds = roc_curve(y_test, y_prob)45# Youđến's J6j_scores = tpr - fpr7optìmal_idx = np.argmax(j_scores)8optìmal_threshold = thresholds[optìmal_idx]910print(f"Optìmal Threshold (Youđến's J): {optìmal_threshold:.4f}")4.3 Phương pháp 3: Theo Business Requirement
Vi du y te - ưu tiên Recall >= 0.95:
1# Tìm threshold thấp nhất để Recall >= 0.952for i, r in enumerate(recall):3 if r >= 0.95:4 threshold = thresholds[i]5 prec = precision[i]6 print(f"Threshold: {threshold:.4f}")7 print(f"Recall: {r:.4f}, Precision: {prec:.4f}")8 break⚠️ Ảnh hưởng của Threshold
5. Ảnh hưởng của Threshold
5.1 Bảng tóm tắt
| Threshold | Precision | Recall | Khi nào dùng |
|---|---|---|---|
| Cao (0.8) | Cao | Thấp | Spam filter, giảm FP |
| Trung bình (0.5) | Cân bằng | Cân bằng | General purpose |
| Thấp (0.3) | Thấp | Cao | Y te, fraud, giảm FN |
5.2 Tóm tắt Trade-off
Threshold cao (0.7-0.9):
- Ít predict Positive
- Precision cao, Recall thấp
- Ít FP, nhiều FN
- Đúng khi: FP cost cao (spam filter)
Threshold thấp (0.2-0.4):
- Nhiều predict Positive
- Precision thấp, Recall cao
- Nhiều FP, ít FN
- Đúng khi: FN cost cao (y te, fraud)
💻 Thực hành với Scikit-learn
6. Thực hành với Scikit-learn
6.1 Code hoàn chỉnh
1import numpy as np2from sklearn.datasets import make_classification3from sklearn.model_selection import train_test_split4from sklearn.linear_model import LogisticRegression5from sklearn.metrics import (precision_recall_curve, average_precision_score,6 precision_score, recall_score, f1_score)7import matplotlib.pyplot as plt89# Tao imbalanced data10X, y = make_classification(n_samples=1000, n_features=20,11 weights=[0.9, 0.1], random_state=42)12X_train, X_test, y_train, y_test = train_test_split(13 X, y, test_size=0.3, random_state=4214)1516# Train model17model = LogisticRegression()18model.fit(X_train, y_train)19y_prob = model.predict_proba(X_test)[:, 1]2021# PR Curve22precision, recall, thresholds = precision_recall_curve(y_test, y_prob)23ap = average_precision_score(y_test, y_prob)2425# Ve PR Curve26plt.figure(figsize=(10, 6))27plt.plot(recall, precision, color='blue', lw=2,28 label=f'PR curve (AP = {ap:.3f})')29plt.axhline(y=sum(y_test)/len(y_test), color='gray', 30 linestyle='--', label='No skill')31plt.xlabel('Recall')32plt.ylabel('Precision')33plt.title('Precision-Recall Curve')34plt.legend()35plt.grid(True)36plt.show()3738# Tim optìmal threshold39f1_scores = 2 * (precision[:-1] * recall[:-1]) / (precision[:-1] + recall[:-1] + 1e-10)40optìmal_idx = np.argmax(f1_scores)41optìmal_threshold = thresholds[optìmal_idx]4243print(f"Optìmal Threshold: {optìmal_threshold:.4f}")44print(f"Precision: {precision[optìmal_idx]:.4f}")45print(f"Recall: {recall[optìmal_idx]:.4f}")46print(f"F1: {f1_scores[optìmal_idx]:.4f}")6.2 So sánh với default threshold
1# Default threshold = 0.52y_pred_default = (y_prob >= 0.5).astype(int)3print("\n=== Default Threshold (0.5) ===")4print(f"Precision: {precision_score(y_test, y_pred_default):.4f}")5print(f"Recall: {recall_score(y_test, y_pred_default):.4f}")6print(f"F1: {f1_score(y_test, y_pred_default):.4f}")78# Optìmal threshold9y_pred_optìmal = (y_prob >= optìmal_threshold).astype(int)10print(f"\n=== Optìmal Threshold ({optìmal_threshold:.4f}) ===")11print(f"Precision: {precision_score(y_test, y_pred_optìmal):.4f}")12print(f"Recall: {recall_score(y_test, y_pred_optìmal):.4f}")13print(f"F1: {f1_score(y_test, y_pred_optìmal):.4f}")⚖️ Ưu nhược điểm
7. Uu nhuoc điểm
PR Curve vs ROC Curve
| Aspect | PR Curve | ROC Curve |
|---|---|---|
| Imbalanced data | Tot | Co the misleading |
| Interpretability | Truc quan hon | Pho bien hon |
| Focus | Positive class | Ca 2 classes |
| Baseline | Ty le positive | Duong cheo |
📝 Tổng Kết
Key Takeaways:
- 🎚 Threshold = 0.5 không phải lúc nào cũng tối ưu
- 📈 PR Curve hữu ích hơn ROC khi data imbalanced
- ⚖️ F-beta Score cho phép điều chỉnh tầm quan trọng Precision vs Recall
- 🎯 Optimal threshold tùy thuộc business context
- 💻 Scikit-learn:
precision_recall_curve(),average_precision_score()
Bài tập tự luyện
- Bài tập 1: Tính Precision, Recall, F1 cho threshold = 0.3, 0.5, 0.7
- Bài tập 2: Vẽ PR Curve cho dataset có tỷ lệ 95% negative
- Bài tập 3: Tìm threshold để đạt Recall >= 0.9 với Precision cao nhất
Tài liệu tham khảo
| Nguồn | Link |
|---|---|
| Scikit-learn Precision-Recall | scikit-learn.org |
| PR vs ROC Curves | biostat.wisc.edu |
| Google ML - Thresholds | developers.google.com |
Câu hỏi tự kiểm tra
- Threshold mặc định 0.5 không phải lúc nào cũng tối ưu — hãy cho ví dụ bài toán cần hạ threshold và bài toán cần tăng threshold.
- Precision-Recall Curve khác ROC Curve như thế nào? Khi nào PR Curve hữu ích hơn?
- F-beta Score là gì? Khi beta = 2, metric này ưu tiên Precision hay Recall?
- Làm thế nào để tìm optimal threshold dựa trên business constraints (ví dụ: Recall >= 0.9)?
🎉 Tuyệt vời! Bạn đã hoàn thành bài học Threshold Analysis và Precision-Recall Curve!
Tiếp theo: Cùng học Cross-Validation — kỹ thuật đánh giá model khách quan nhất!
Checkpoint
Bạn đã nắm vững Threshold Analysis chưa? Sẵn sàng sang Cross-Validation!